How companies can reduce carbon emissions and achieve incremental efficiencies in their fleets over time. Learn more.
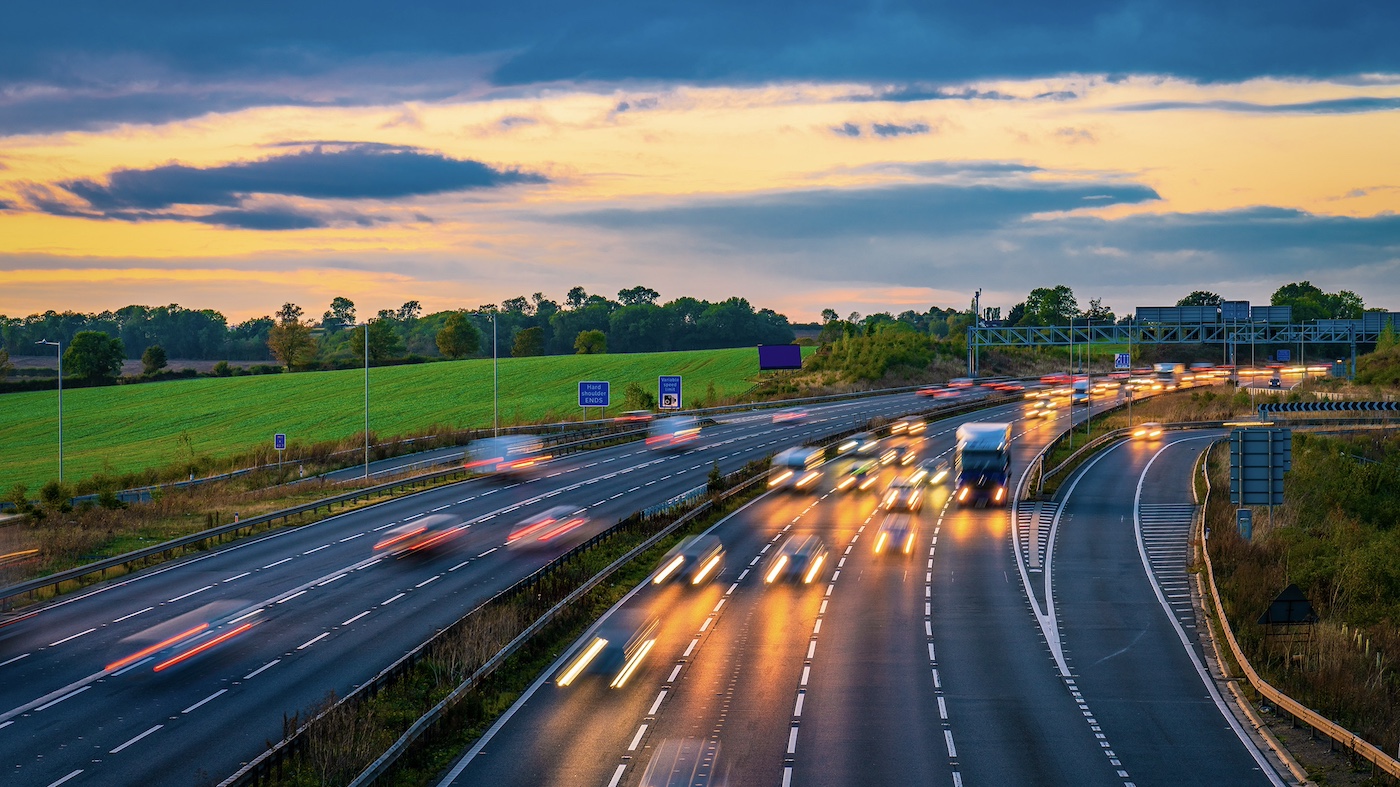
Here we have summarised some of the ways in which fleets can work with their drivers to ensure a safer, greener future.
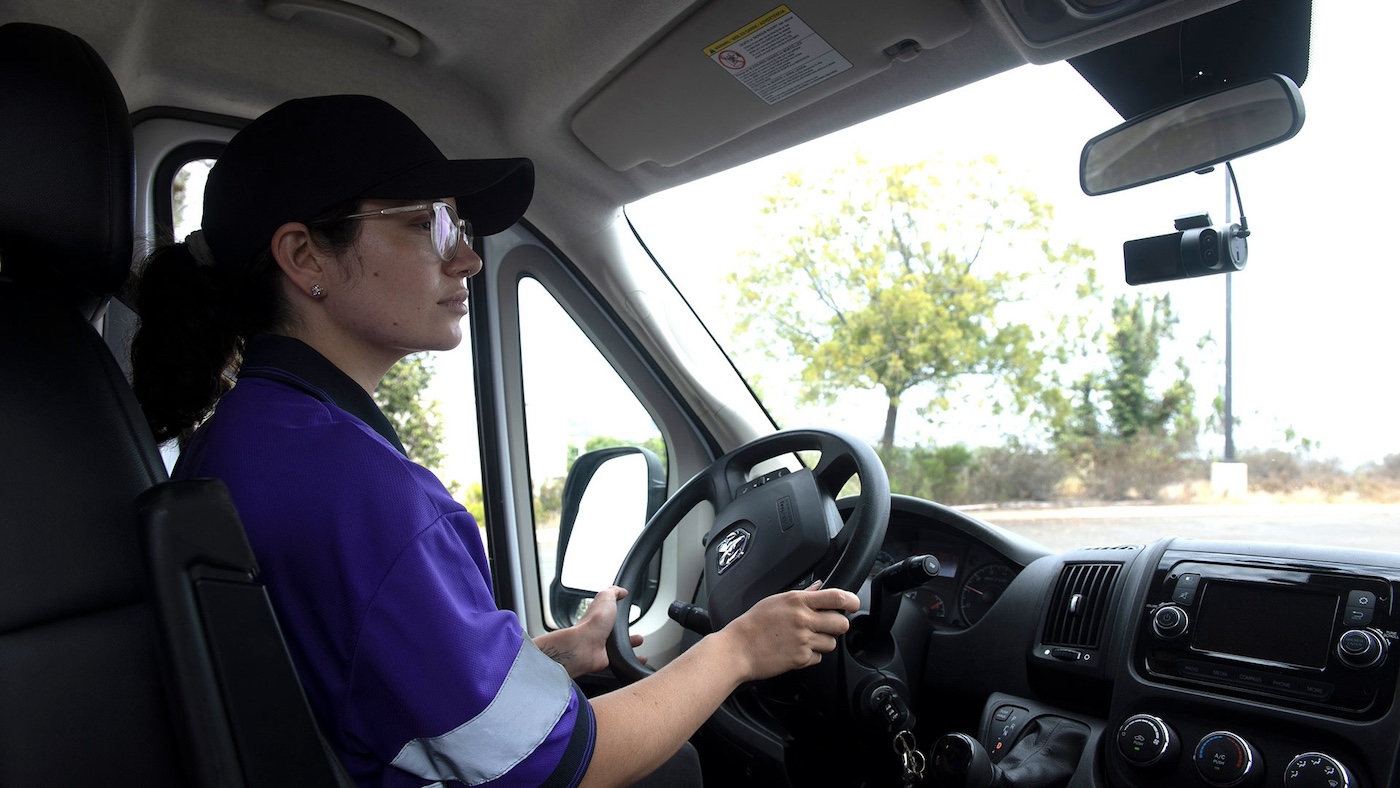
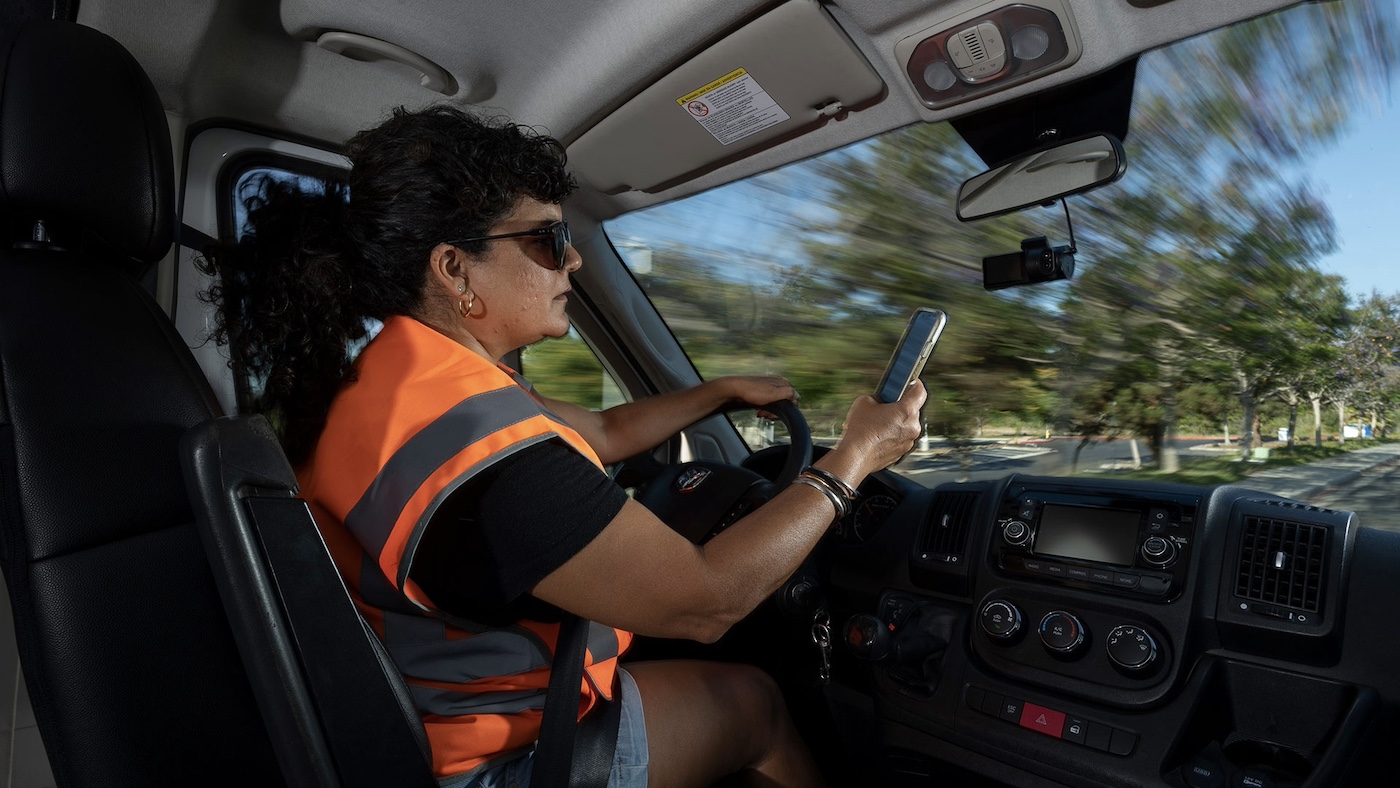
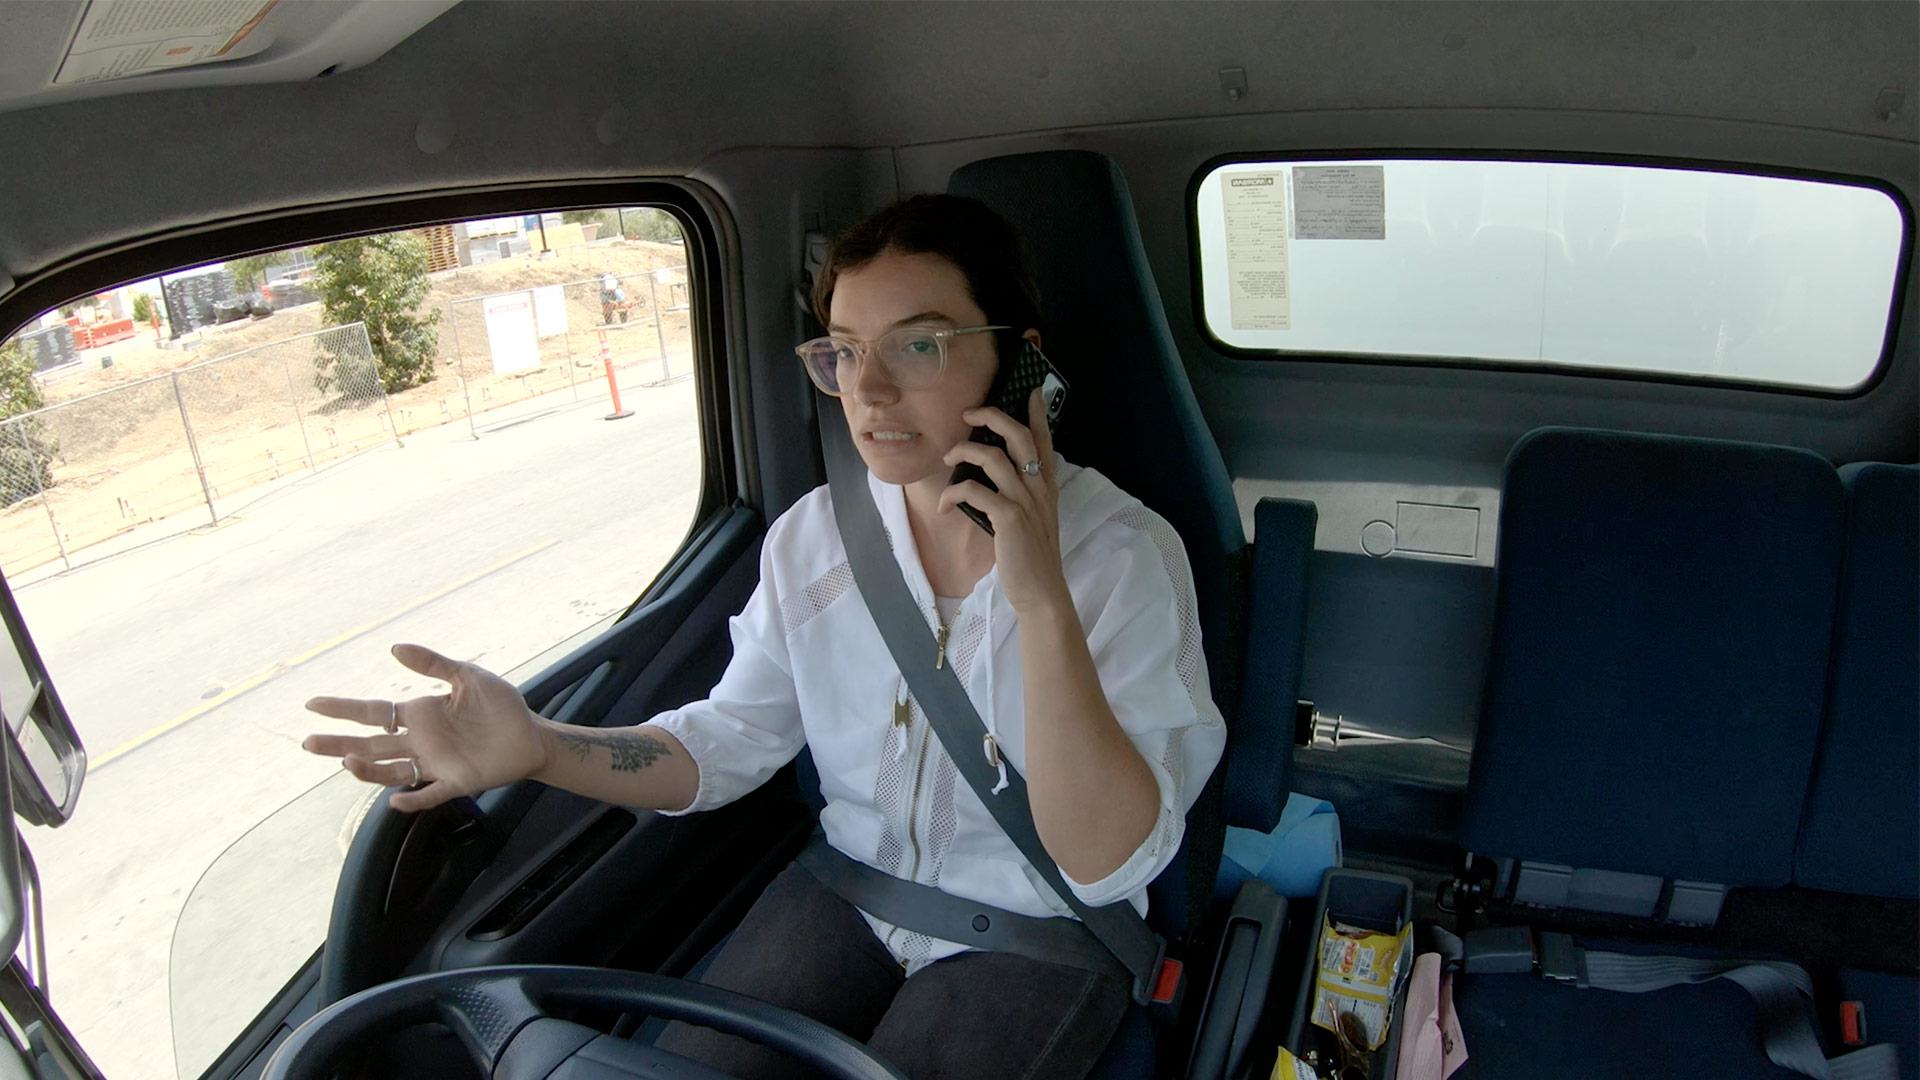
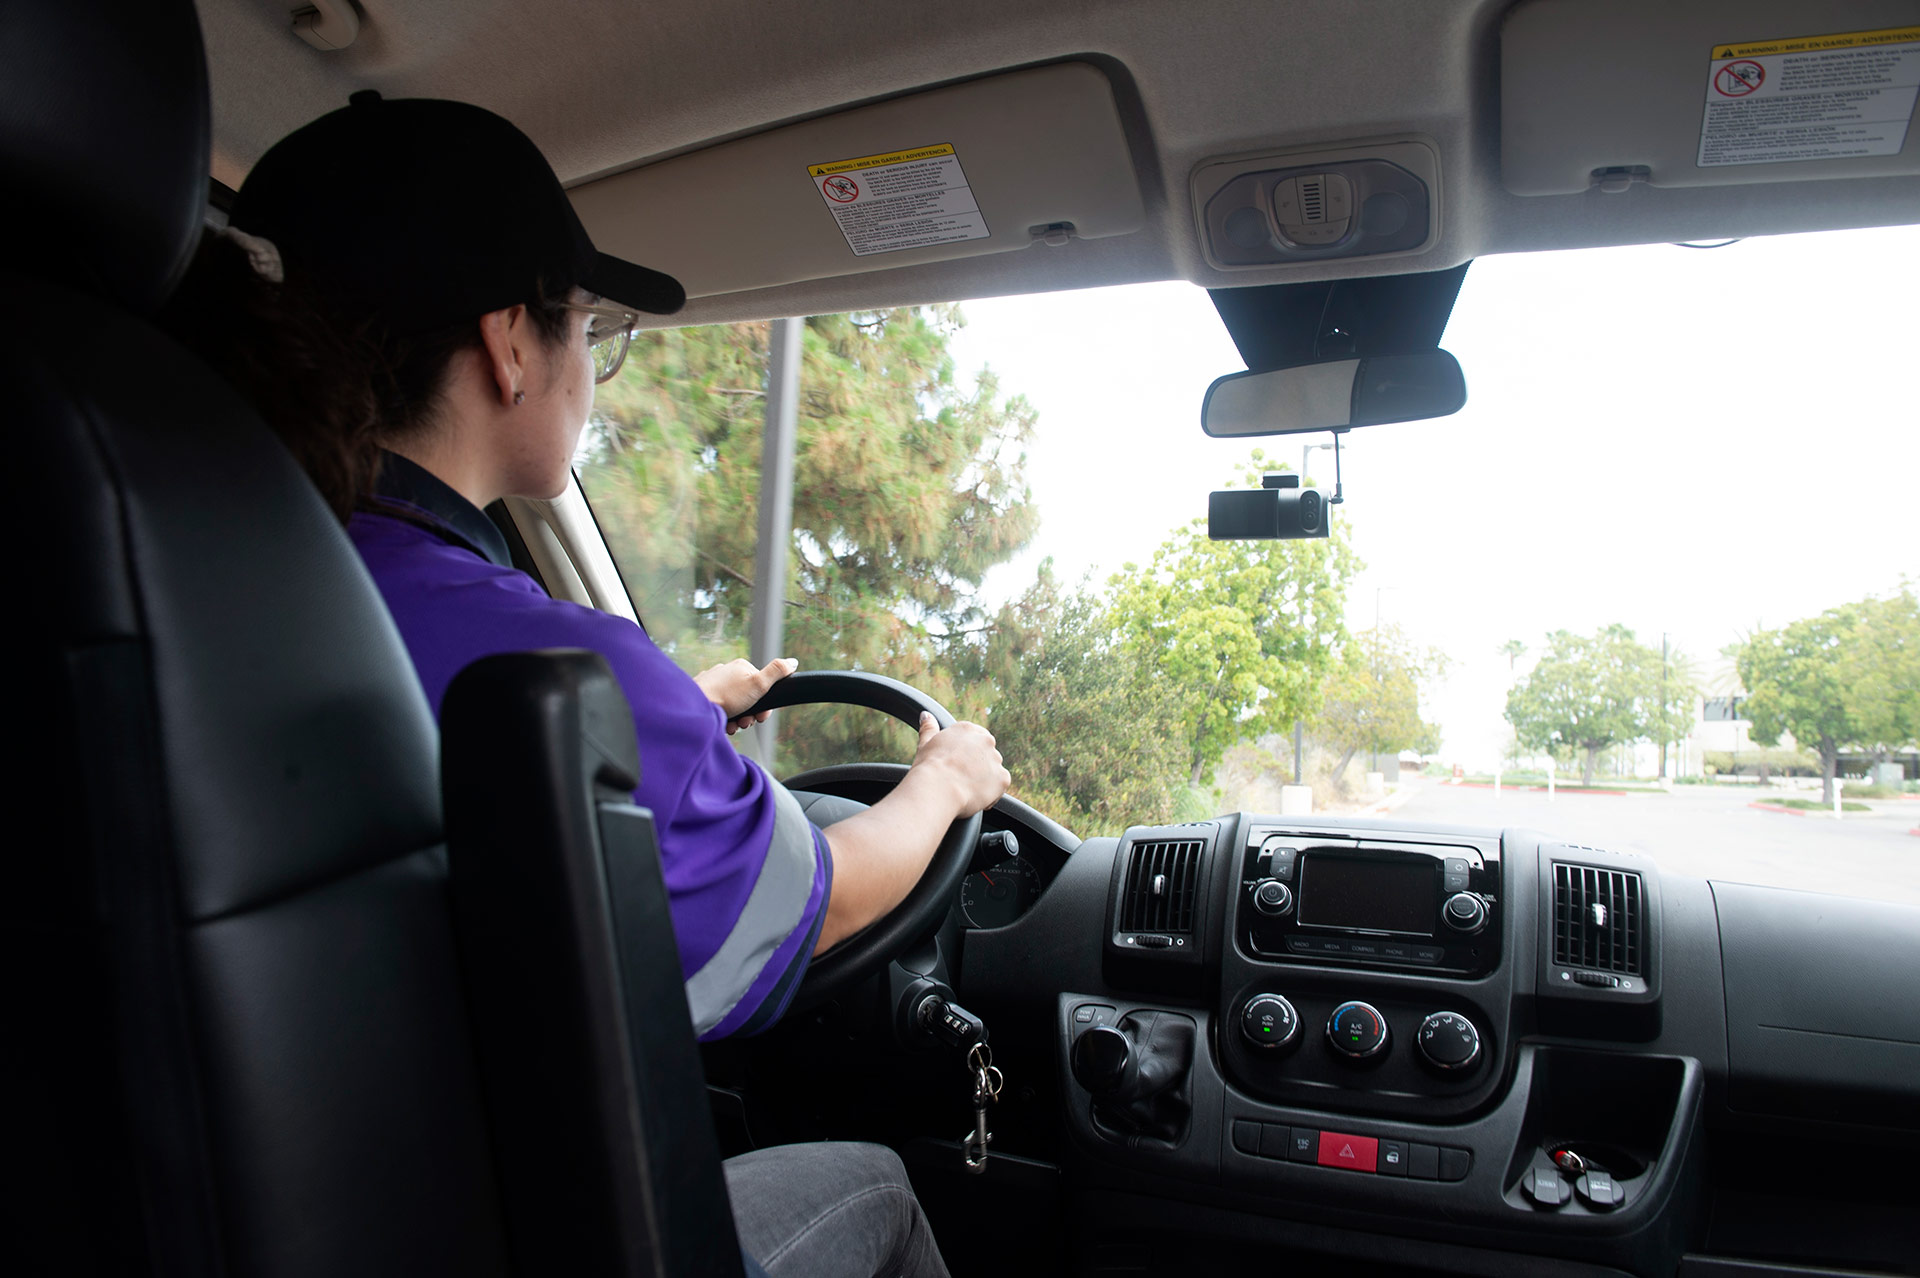
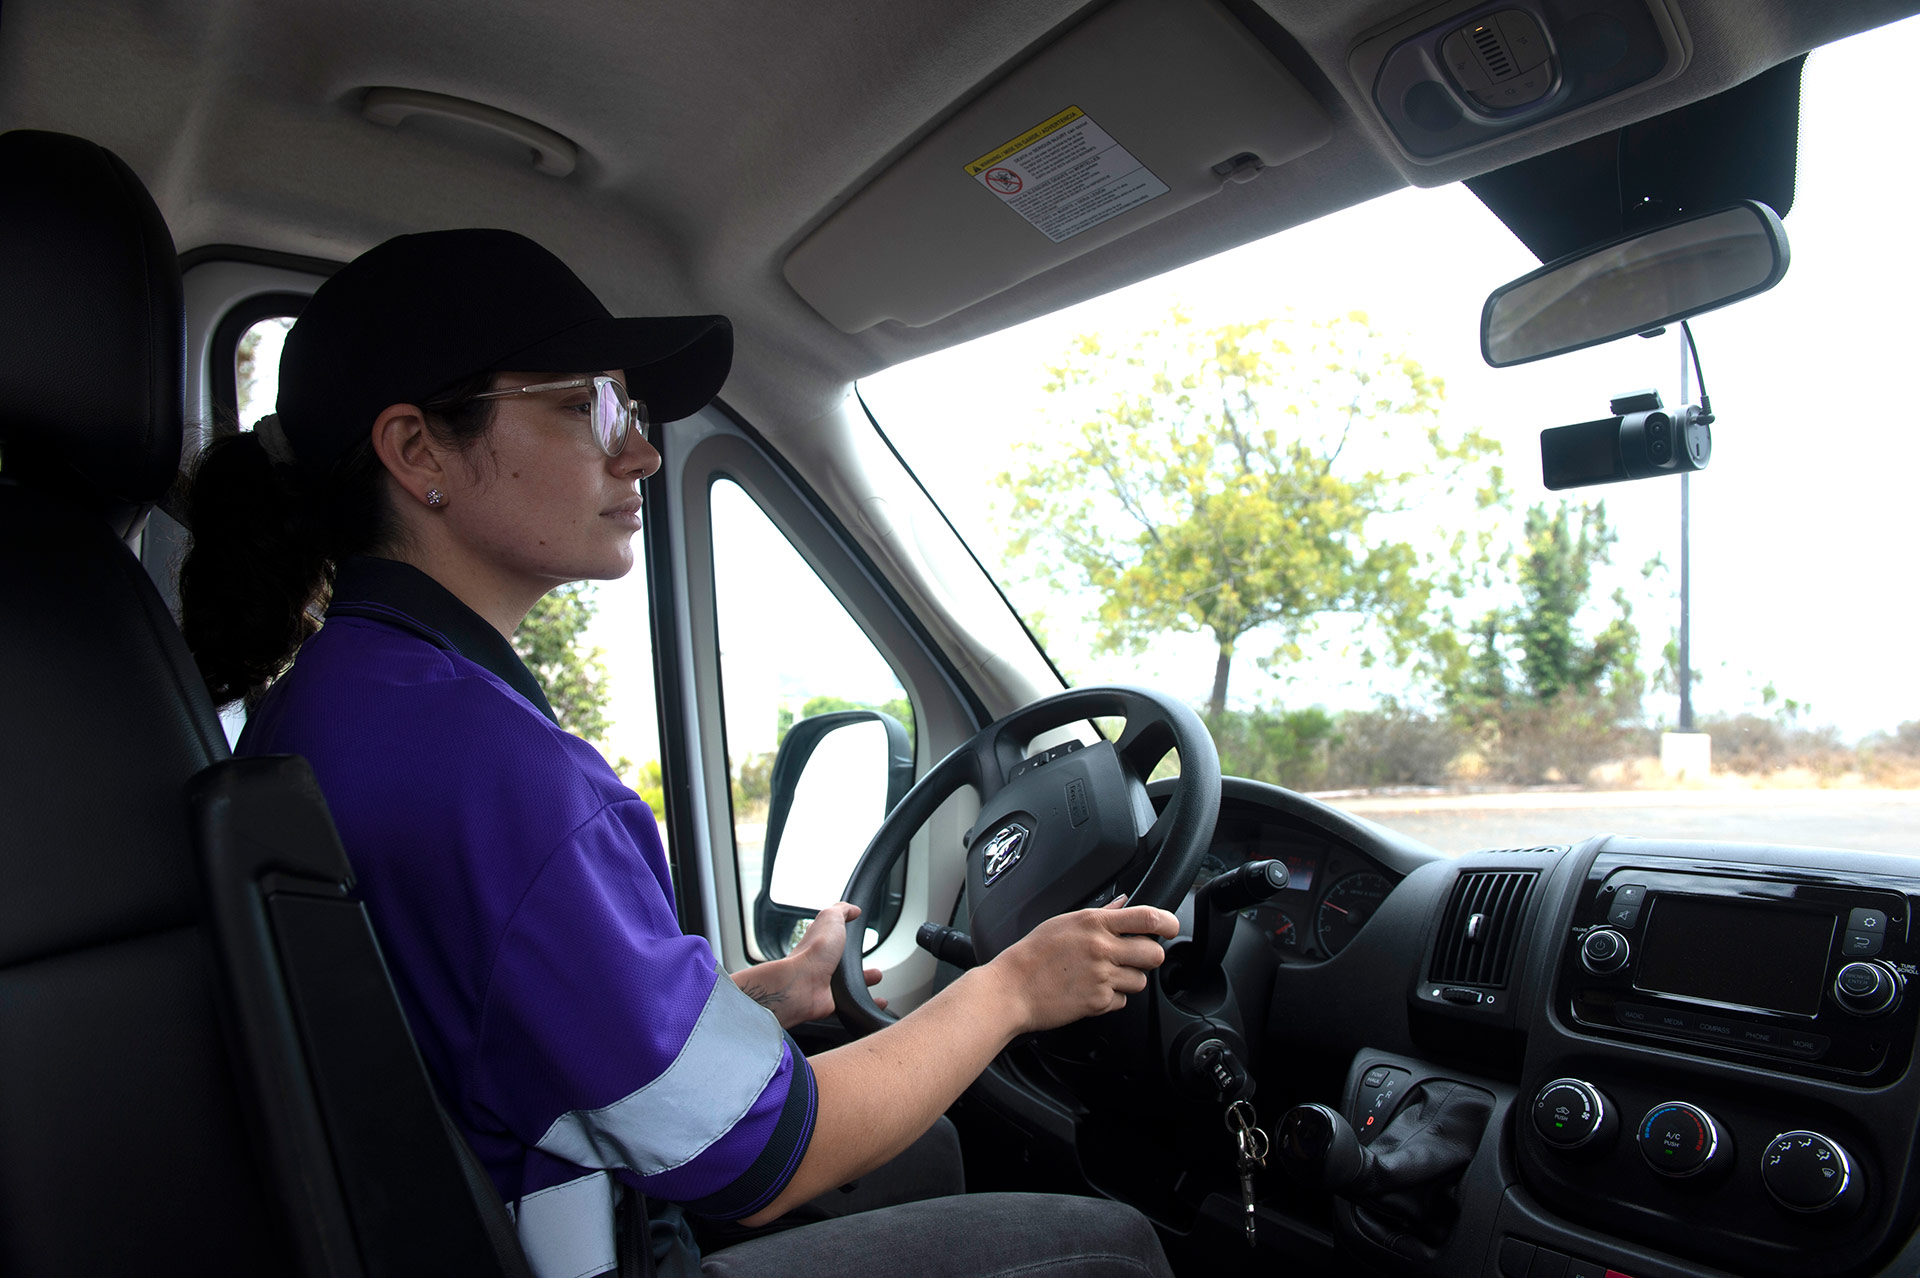
The best dash cam is a combination of a camera, multiple sensors, and machine vision with artificial intelligence to help you make your fleets safer and more efficient.